🔹 A Brief Overview of Color Trading
Color trading is a visual approach to technical analysis where traders use color-coded elements to interpret financial market data and act on it more efficiently. Instead of relying solely on traditional candlestick patterns or black and white indicators, color trading introduces visual cues – using specific colors to represent different market conditions, trends, or signals. This approach enhances the trader’s ability to quickly assess market dynamics, making it easier to identify opportunities and risks in real-time.
✅ What it means
In simple terms, color trading transforms raw market data into an instantly understandable visual language. This method bridges the gap between complex numerical data and actionable insights, allowing traders to visualize trends and patterns that may not be immediately obvious when looking at conventional charts.
For example:
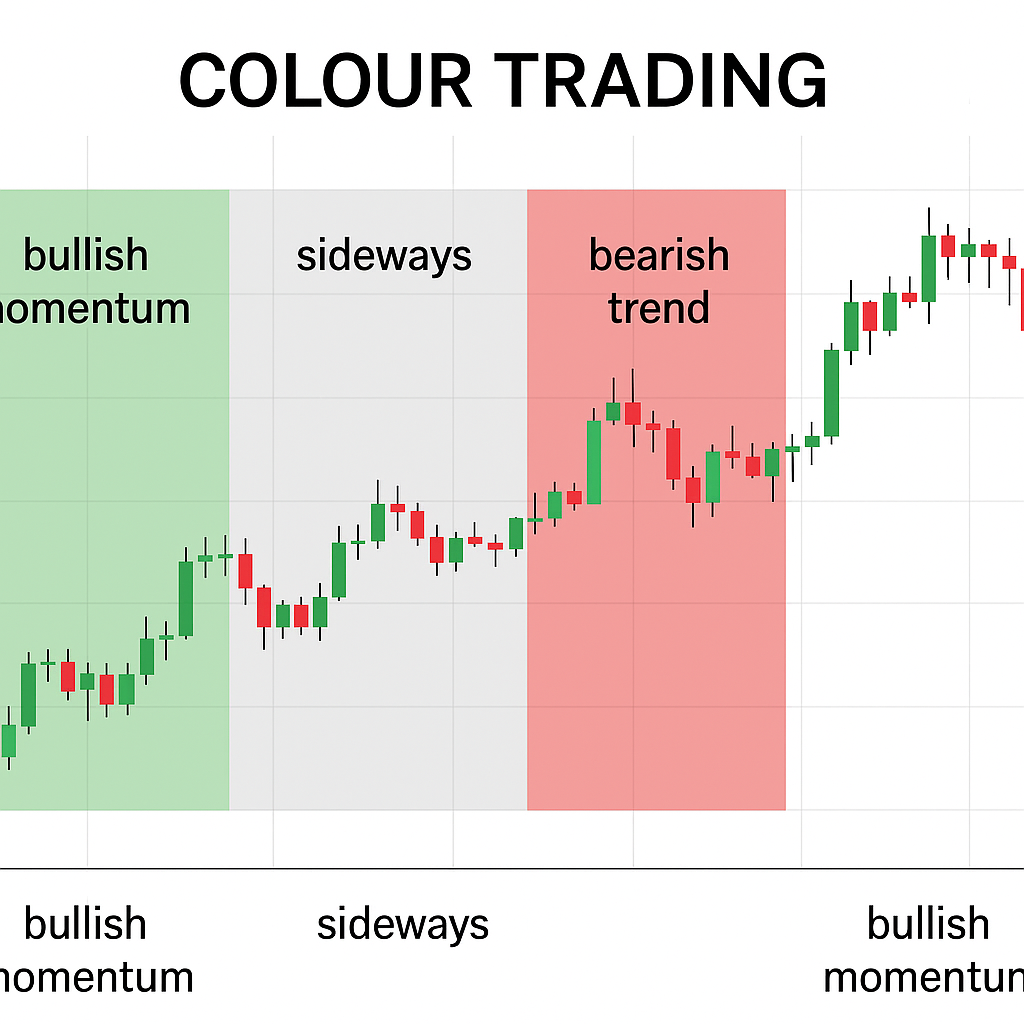
In practice, this means that traders can quickly identify bullish or bearish trends without having to analyze multiple indicators. An effective color trading system can significantly shorten the time required to make informed trading decisions.
Green color can represent bullish momentum or a buy signal, often indicating that the asset is gaining value and may continue to do so. Traders may look for confirmation of this signal through other indicators, such as volume spikes or positive news surrounding the asset.
Red color can show bearish pressure or a sell signal, which suggests that the asset is losing value. Traders often prepare for potential downturns when they see consistent red indicators on their charts, using stop-loss orders to mitigate losses.
Blue or yellow color can highlight areas of support/resistance, which are critical points where a stock’s price might bounce back or face obstacles. Understanding these zones helps traders make smarter entry and exit points.
Gradients (such as darker or lighter shades) can show the strength of a trend or volume, providing insight into market momentum. For instance, a stronger trend may be indicated by a deeper green, while lighter shades could suggest weakening momentum.
By giving colors consistent meaning, traders can scan charts faster, make decisions quicker, and reduce analysis fatigue, thus increasing their potential for successful trades in fast-moving markets.
🔍 Where it’s used
Color trading is typically applied to various financial tools, enhancing the user experience across a range of platforms and chart types.
Candlestick charts (e.g., green = up, red = down) are a popular choice among traders, allowing for quick visual assessment of price movements over time.
Volume bars (e.g., brighter = stronger activity) enable traders to gauge the intensity of trading within a particular timeframe, indicating whether a trend is likely to continue.
Moving averages (e.g., change color when slope changes) help smooth out price action by filtering out the ‘noise’ of fluctuations, allowing traders to focus on the underlying trend.
Indicators like RSI, MACD, EMA (with custom color triggers) can help identify overbought or oversold conditions, enhancing decision-making on potential reversals or continuations.
Platforms like TradingView, MetaTrader, and ThinkOrSwim allow traders to apply these visual enhancements using custom scripts, plugins, or built-in chart templates, giving them the flexibility to tailor their trading experience to their own preferences.
🧠 Why it matters
Traditional chart reading can be overwhelming, especially when multiple indicators are layered or when quick decisions need to be made in volatile markets. Color trading simplifies this process by transforming numerical and technical data into clear, visual feedback that is easy to digest.
This is particularly beneficial in fast-paced environments like day trading or swing trading, where the ability to quickly analyze data can mean the difference between profit and loss.
It helps to:
Reduce decision fatigue by allowing your brain to process information visually rather than textually. This shift can lead to quicker and more accurate trading decisions.
Improve reaction times as you train your brain to respond to color changes that signify critical trading signals, enhancing your ability to act swiftly.
Reduce misinterpretation of signals by having a consistent color-coding strategy that ensures you are less likely to confuse bullish signals with bearish ones.
Make trading more intuitive, especially under pressure, as a well-designed color scheme can support better decision-making even in high-stress situations.
🎯 In short
Colored trading is not a standalone strategy but rather a powerful enhancement to traditional technical analysis. It enables traders to see the market more clearly, understand signals faster, and execute with more confidence. By integrating a color-coded approach into your trading routine, you can significantly streamline your workflow, improve your trading results, and ultimately maximize your profitability.